Fugitive emission monitoring
Catch emission events as they happen. Trace them to their source.
Wireless, battery-powered sensors on your fenceline, stockpiles and process installations. Our software flags each incident, tracks how far it reached and points to the likely source.


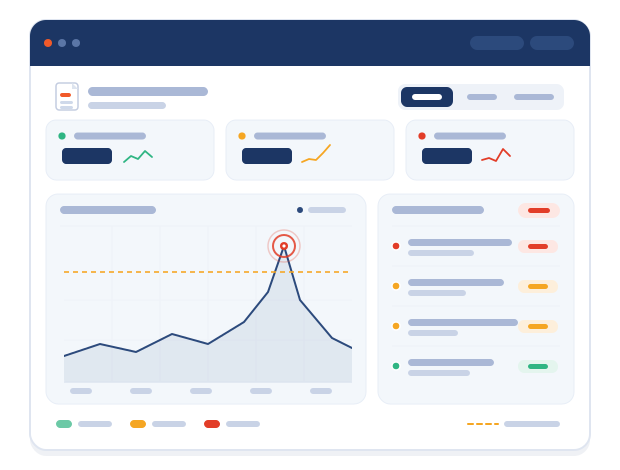
● Incident · F-03 fenceline
14:32 · PM10 above threshold
Likely source
Stockpile B
Wind SW · 6 m/s
The problem
Fugitive emissions don't wait for your measurement campaign.
“
On Tuesday, a neighbour calls about dust on their car on Sunday night. Your reference station shows a normal daily average. Your last measurement campaign was in spring.
You know something happened. You can’t show what, where or why.”
A familiar Tuesday for EHS teams
Sporadic
Minutes, not days.
Dust peaks last minutes. A daily average flattens them.
Diffuse
Many sources at once.
Stockpiles, conveyors, slag and traffic emit together, across the whole site.
Intermittent
Gone before anyone looks.
By the time someone checks, the dust has moved with the wind.
Regulation
Under the revised IED and other regulations, diffuse emissions get more attention in permitting and inspection.
why existing solutions fall short
A single point measurement can't describe a kilometre-wide site.
Stack analysers and spot samples were built for one location and one moment. Fugitive emissions drift, spike and move with the wind across dozens of sources at once.
HOW IT WORKS
From an emission peak to its likely source, in four steps.
Wireless sensors in the field, an IoT network that needs no cabling, and software built for the people who handle complaints and inspections.
01 · Monitor
Sensors where emissions start.
Wireless, battery-powered sensors on fencelines, stockpiles and process installations, indoors and out. Dust is measured continuously in five particle sizes.
PM0.5–PM10
Gas / VOC / noise / wind


02 · Detect
Each incident logged, with start, duration and severity.
When levels cross the threshold you set for a location, the platform opens an incident and alerts your team.
Thresholds per location
Real-time alerts
03 · Assess
See how severe it was, and how far it reached.
Time-weighted averages, durations and trends per location, compared month on month. Fenceline sensors show what reached your neighbours.
24h time-weighted average
Trends
Reports


04 · Identify
Trace it back to the likely source.
Sensor patterns and wind direction on one map point upwind, to the likely source. Process data from your own systems shows what was running at the time.
Wind correlation
Interactive mapPING
In practice
One afternoon, one dust incident, start to finish.
Six minutes from first peak to likely source. Our software does the detective work.
Site Scan pilot
See where your dust comes from. In six weeks.
A defined scope on your own site, a fixed timeline, and a findings report at the end. No cabling, no long-term commitment.
Weeks 1-2
Site tour and sensor plan
We map your sources, fenceline and neighbours, and agree where sensors go.
Week 3
Installation
Battery-powered sensors and wind meters, mounted in days. No cabling.
Weeks 3-6
Continuous monitoring
Your team gets alerts and dashboards from day one. We review incidents with you.
Week 6
Findings report
Where and when peaks occur, and the likely sources behind them.
Sensors, network and platform access included
A list of likely sources, ranked
Afterwards: keep the network, keep monitoring
PROVEN ON THE FLOOR
Running where the conditions are hardest.
We are deployed on the asset base of Fortune-500 and multinational enterprise customers, often in some of the harshest production environments there are.


GOT QUESTIONS? REQUEST A DEMO?
Turn the IED deadline into a head start.
Tell us about your site and we'll show you our emission intelligence technology mapped onto it, with a deployment plan for your highest-risk sources.